How to Figure the Common Size Balance-Sheet Percentages
For example, you may show merchandise inventory or accounts receivable as a percentage of total assets. The balance sheet uses this presentation on individual items like cash or a group of items like current assets. Cash is listed as an individual entry in the assets section with the total balance being listed on the left and its percentage of total assets being listed on the right. The income statement also uses this presentation with revenue entries referencing total revenues and expense entries referencing total expenses. Company management often analyzes financial statement data to understand how the business is performing relative to where it was historically, and relative to where it wants to go in the future.
Managerial Accounting
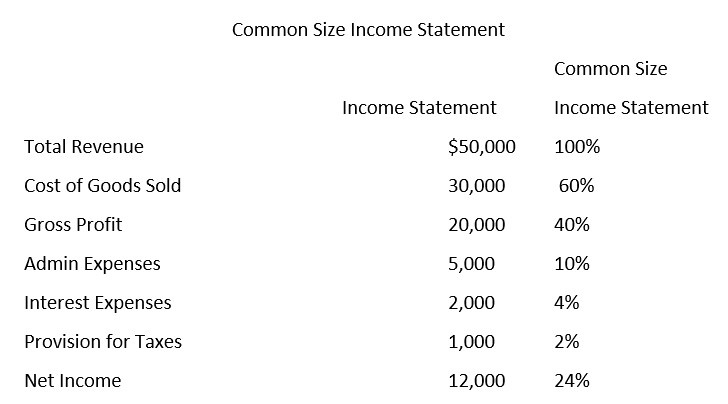
Common-size analysis allows for the evaluation of information from one period to the next within a company and between competing companies. A common size income statement is an income statement in which each line item is expressed as a percentage of the value of revenue or sales. It is used for vertical analysis, in which each line item in a financial statement is represented as a percentage of a base figure within the statement. The same process would apply on the balance sheet but the base is total assets.
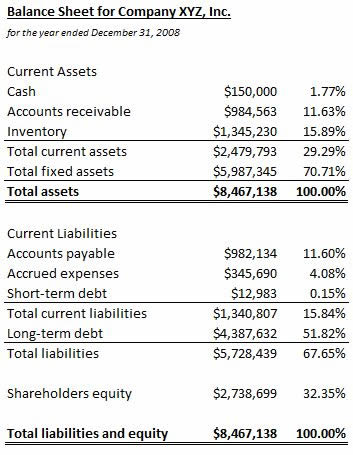
For the balance sheet, the total assets of the company will show as 100%, with all the other accounts on both the assets and liabilities sides showing as a percentage of the total assets number. Common size financial statements help to analyze and compare a company’s performance over several periods with varying sales figures.
The common size percentages are calculated to show each line item as a percentage of the standard figure or revenue. Generally accepted accounting principles (GAAP) are based on consistency and comparability of financial statements. A common size income statement makes it easier to see what’s driving a company’s profits. The common size percentages also help to show how each line item or component affects the financial position of the company.
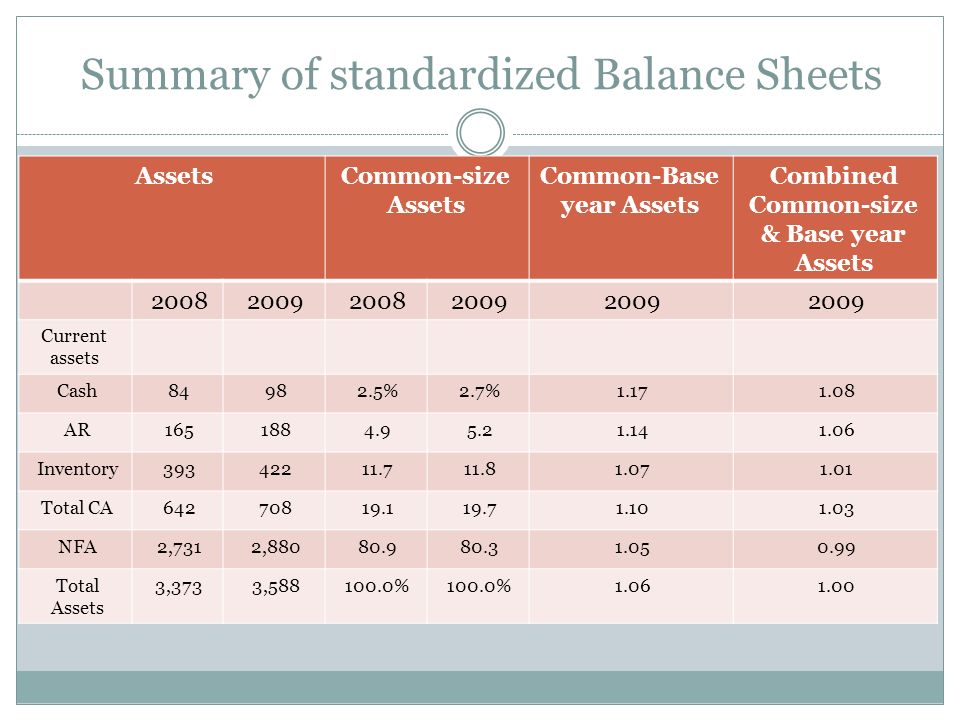
consists of the study of a single financial statement in which each item is expressed as a percentage of a significant total. Vertical analysis is especially helpful in analyzing income statement data such as the percentage of cost of goods sold to sales. Where horizontal analysis looked at one account at a time, vertical analysis will look at one YEAR at a time. To conduct a vertical analysis of balance sheet, the total of assets and the total of liabilities and stockholders’ equity are generally used as base figures. All individual assets (or groups of assets if condensed form balance sheet is used) are shown as a percentage of total assets.
All percentage figures in a common-size balance sheet are percentages of total assets while all the items in a common-size income statement are percentages of net sales. The use of common-size statements facilitates vertical analysis of a company’s financial statements. The amount of cash on a company’s balance sheet consists of its physical currency, bank account balances and checks from customers that it has yet to deposit. The amount of total assets is the amount of its total resources that it uses in its business.
For trend analysis, it’s useful to look at a company’s activity from one time period to the next. For example, inventory might be a much larger percentage of total assets this year, which could mean the company’s chosen slow-moving merchandise needs to match prices with the competition. Also, common-size balance sheets work very well for comparing a company to its competitors or to an industry standard. This type of analysis is often used when performing due diligence for an acquisition, a valuation or any other financial transaction.
Common Size Balance Sheet Defined
The common-size percentages on the balance sheet explain how our assets are allocated OR how much of every dollar in assets we owe to others (liabilities) and to owners (equity). Many computerized accounting systems automatically calculate common-size percentages on financial statements. Common-size percentages, used in analyzing the balance sheet and also the income statement, are a calculation that sets each line item as a percent of one standard amount. On the balance sheet, you would set every other asset and liability line item as a percent of total assets. The standard figure used in the analysis of a common size income statement is total sales revenue.
Common-size analysis converts each line of financial statement data to an easily comparable amount measured as a percent. Income statement items are stated as a percent of net sales and balance sheet items are stated as a percent of total assets (or total liabilities and shareholders’ equity).
The most valuable aspect of a common size balance sheet is that it supports ease of comparability. The common size balance sheet shows the makeup of a company’s various assets and liabilities through the presentation of percentages, in addition to absolute dollar values. This affords the ability to quickly compare the historical trend of various line items or categories and provides a baseline for comparison of two firms of different market capitalizations. Additionally, the relative percentages may be compared across companies and industries. A common size balance sheet is a balance sheet that displays both the numeric value and relative percentage for total assets, total liabilities, and equity accounts.
- The amount of cash on a company’s balance sheet consists of its physical currency, bank account balances and checks from customers that it has yet to deposit.
- All percentage figures in a common-size balance sheet are percentages of total assets while all the items in a common-size income statement are percentages of net sales.
The current liabilities, long term debts and equities are shown as a percentage of the total liabilities and stockholders’ equity. Vertical analysis (also known as common-size analysis) is a popular method of financial statement analysis that shows each item on a statement as a percentage of a base figure within the statement. To prepare a vertical analysis, you select an account of interest (comparable to total revenue) and express other balance sheet accounts as a percentage.
A vertical analysis is also the most effective way to compare a company’s financial statement to industry averages. Using actual dollar amounts would be ineffective when analyzing an entire industry, but the common-sized percentages of the vertical analysis solve that problem and make industry comparison possible. ABC Company’s income statement and vertical analysis demonstrate the value of using common-sized financial statements to better understand the composition of a financial statement.
Common size balance sheets are used by internal and external analysts and are not a reporting requirement of generally accepted accounting principles (GAAP). If analysis reveals any unexpected differences in income statement accounts, management and accounting staff at the company should isolate the reasons and take action to fix the problem(s). This percentage can be used to compare bothbalance sheetandincome statementperformance within the company. Much like ratio analysis, vertical analysis allows financial information of a small company to be compared with that of a large company. The common size percentage can also be used to compare different companies within the same industry or companies that use different currencies.
The common size percentages can be subsequently compared to those of competitors to determine how the company is performing relative to the industry. For Example, Company A has $10 million in total assets, $7 million in total liabilities and $3 million in total equity. As the common-size balance-sheet reports the assets first in the order of liquidity, the top entry would be of Cash worth $2 million. Apart from this, it would also report the composition of this cash as a percentage of total assets, i.e. 20% ($2 million divided by $10 million). Although common-size balance sheets are most typically utilized by internal management, they also provide useful information to external parties, including independent auditors.
It also shows how a vertical analysis can be very effective in understanding key trends over time. For example, when a vertical analysis is done on an income statement, it will show the top-line sales number as 100%, and every other account will show as a percentage of the total sales number. A common size income statement is an income statement whereby each line item is expressed as a percentage of revenue or sales.
Balance Sheet vs. Profit and Loss Statement: What’s the Difference?
You can measure cash as a percentage of total assets to determine the relative amount of cash the company holds. This calculation is called common-size analysis, which compares the amount of a balance sheet account to total assets. Common-size analysis makes it easier to compare cash balances over time and between companies.
As a result, the financial statement user can more easily compare the financial performance to the company’s peers. Vertical analysis restates each amount in the income statement as a percentage of sales. This analysis gives the company a heads up if cost of goods sold or any other expense appears to be too high when compared to sales. Reviewing these comparisons allows management and accounting staff at the company to isolate the reasons and take action to fix the problem(s). An analysis that converts each line of financial statement data to an easily comparable amount measured in percent form.
Spotting Creative Accounting on the Balance Sheet
What is a common size balance sheet?
Definition: A Common Size Balance Sheet is a financial statement that presents the assets, liabilities, and equity of a business with each line item shown as a percentage of the total category.
By doing this, we’ll build a new income statement that shows each account as a percentage of the sales for that year. As an example, in year one we’ll divide the company’s “Salaries” expense, $95,000 by its sales for that year, $400,000. That result, 24%, will appear on the vertical analysis table beside Salaries for year one.
Performing common-size calculations for several different time periods and looking for trends can be especially useful. However, a look at the common size financial statement of the two businesses, which restates each company’s figures as a percent of sales, reveals Company B is actually more profitable. The common size income statement for Company A shows operating profits are 25% of sales (25/100). The same calculation for Company B shows operating profits at 75% of sales (15/20). The common size statements make it easy to see that Company B is proportionally more profitable and better at controlling expenses.
Income statement items are stated as a percent of net sales, and balance sheet items are stated as a percent of total assets (or total liabilities and shareholders’ equity); also called vertical analysis. By analyzing how a company’s financial results have changed over time, common size financial statements help investors spot trends that a standard financial statement may not uncover. The common size percentages help to highlight any consistency in the numbers over time–whether those trends are positive or negative. Large changes in the percentage of revenue as compared to the various expense categories over a given period could be a sign that the business model, sales performance, or manufacturing costs are changing.